Although many companies operating on the Russian market use 1С for their accounting, we often encounter company executives who do not know how to conveniently retrieve and analyze data from this software.
In the previous article we reviewed the payroll reports that are most used. In this article, we are going to look at HR reports from 1C. Each report in 1С comes with numerous variations and selection criteria that can be customized by 1C users for individual convenience. The examples provided in this article are based on standard settings that require no additional input from users.
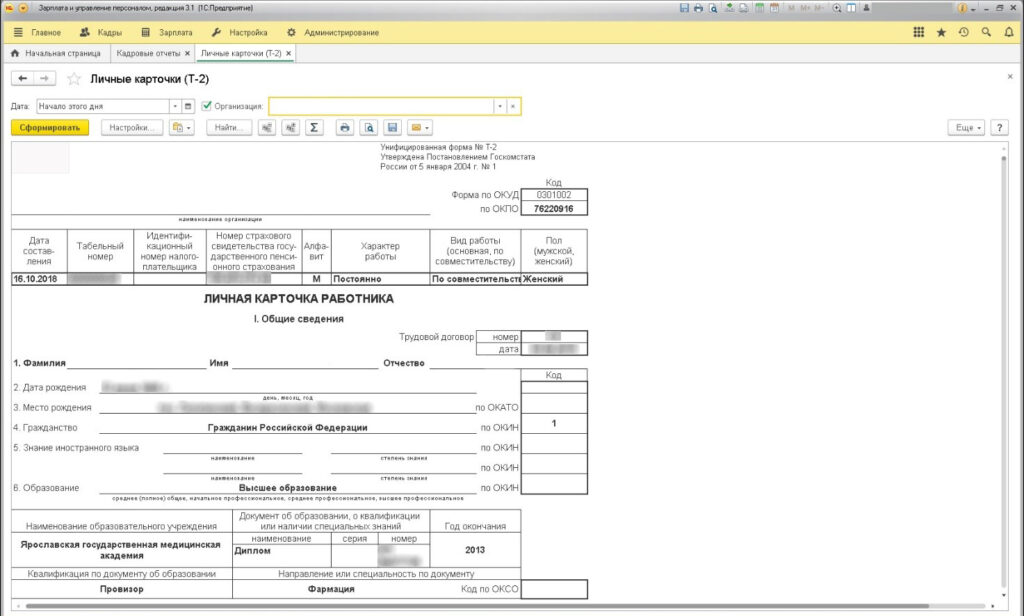
Employee personal record cards (Т-2)
Where?
HR → HR reports → Personal record cards Т-2
What for?
This report contains personal information for each employee: date of birth, place of birth, address of residence, registered address, family composition, education, employment history, hiring, awards and incentives, transfers within the organization and promotions.
This report is useful to managers when they want to find out more about a new employee or they simply have questions about a particular employee.
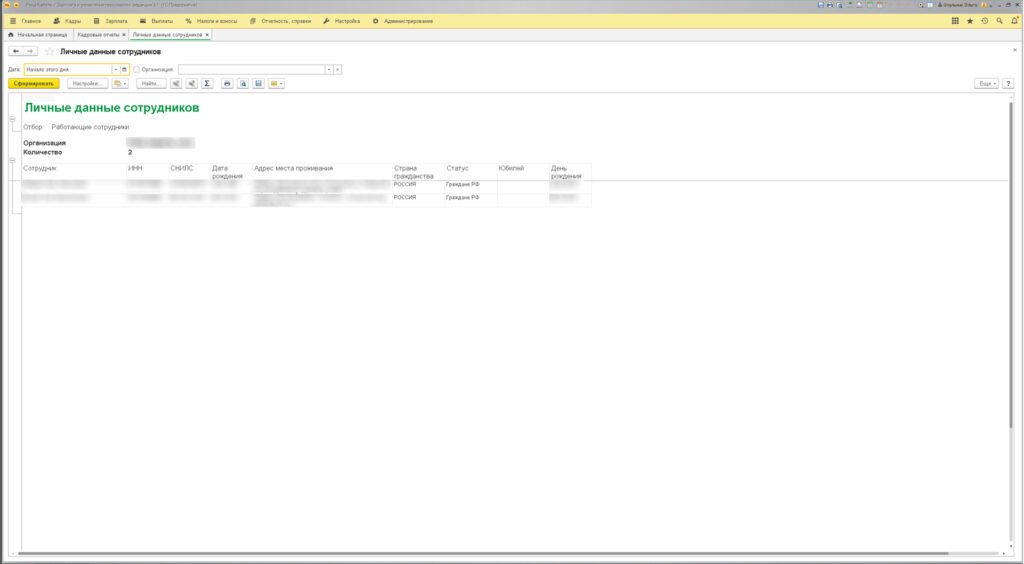
Employee personal data
Where?
HR → HR reports → Staffing changes
What for?
This report allows selecting by department, position and employee.
Whereas personal record cards consist of several pages of information about a selected employee, employee personal data reports can be generated for several employees and a criterion of particular interest such as, for instance, department, position, date of birth, etc.
This report allows viewing data from personal record cards, for example, for employees from a particular department, employees filling a certain position, and gathering such data as per any criteria so it is possible to find out, for example, the average age of employees from accounting or marketing department, the proportion of foreign employees in the workplace, etc.
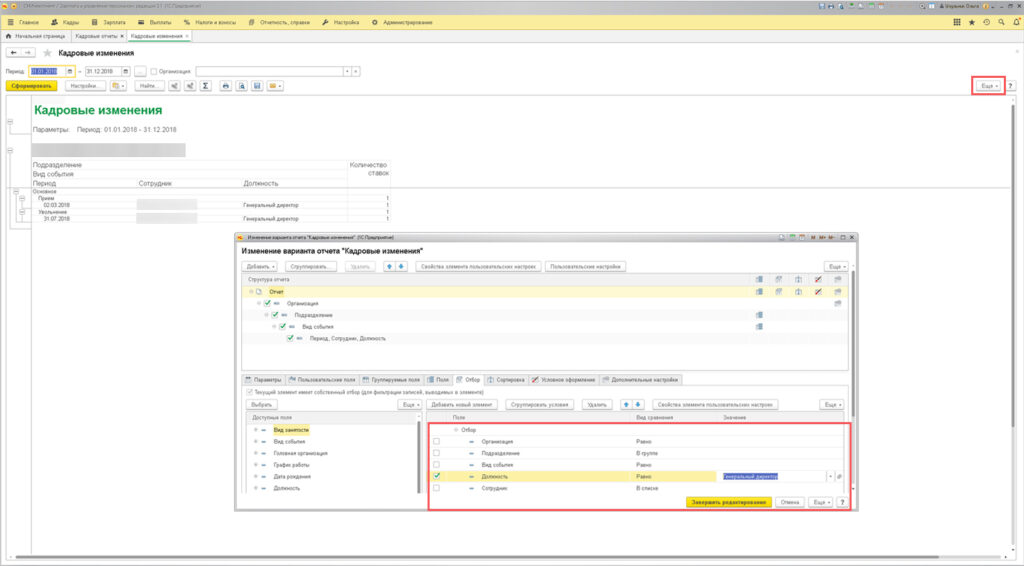
Summary of staffing changes
Where?
HR → HR reports → Staffing changes
What for?
This report helps answering the following questions:
- What personnel changes have occurred in the selected period of time?
- How many people have been dismissed and hired?
- How has the position of a selected employee changed?
- How many people have been dismissed and hired in particular divisions and how often?
How does this help managers?
This report allows selecting different grouping options depending on the objectives and goals managers want to achieve. To this end, click “More” in the upper right corner of the screen, select “Other” → “Change report option” and tick the necessary items in the “Selection” section. The following group options are available:
- Selected department: it is possible to see how many people have been dismissed and hired, monitor how a particular employee has been growing and developing within a division, etc.
- Type of event: hiring, transfer, dismissal, etc.
It is possible to see all dismissed and hired people, understand how staff has increased or decreased and the positions for which new employees have been hired. By selecting all transfers, it is possible to see changes in duties and when this occurred. Transfers show how often employees change jobs. Stability is an indicator that people enjoy working in that particular company. Keeping the same job for a long time is effective in terms of work quality although employees could become bored performing the same duties for many years. Horizontal mobility, which consists in changing duties, for example, within a department, helps retaining good staff. This is possible when employees have specialized education and are, in theory, already familiar with the duties they will have to perform. In such cases, employees are motivated and eager to do and learn new things, while their colleagues are happy to train someone they already know. - Position: It is possible to see who fills the selected position, for how much and when was this employee hired.
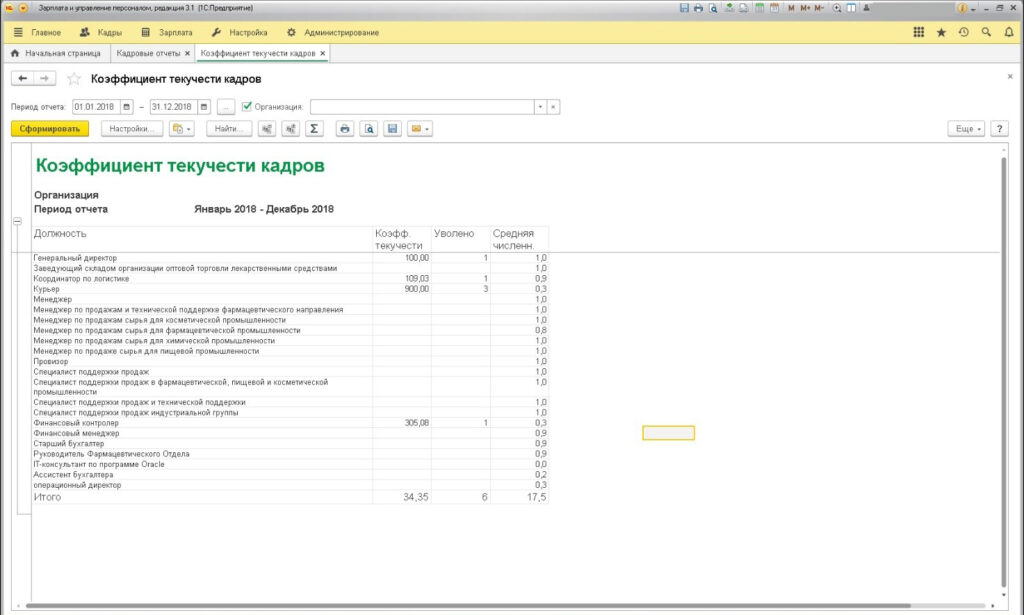
Staff turnover rate
Where?
HR → HR reports → Staff turnover rate
What for?
This report provides information about staff hiring, dismissal and average number.
Staff turnover rate is the ratio of employees dismissed over a certain reporting period to staff average number for the same period.
The screenshot shows a report with standard settings (for an entire organization). Reports may also be generated for a department, individual or position.
When analyzing turnover rates, it is important to bear in mind that these rates are affected by the total number of employees as well as how often people are hired and dismissed. For example, if a company consists only in a single general director with no other staff, and the general director is hired and dismissed, then the staff turnover rate will be 100%.
Turnover allows managers to identify and eliminate what prevents effective work. If employees are dismissed from a department much more than from others, then it would make sense to review HR policy and management style as well as find out the actual reasons for staff turnover.
Vacation balance
Where?
HR → HR reports → Vacation balance
What for?
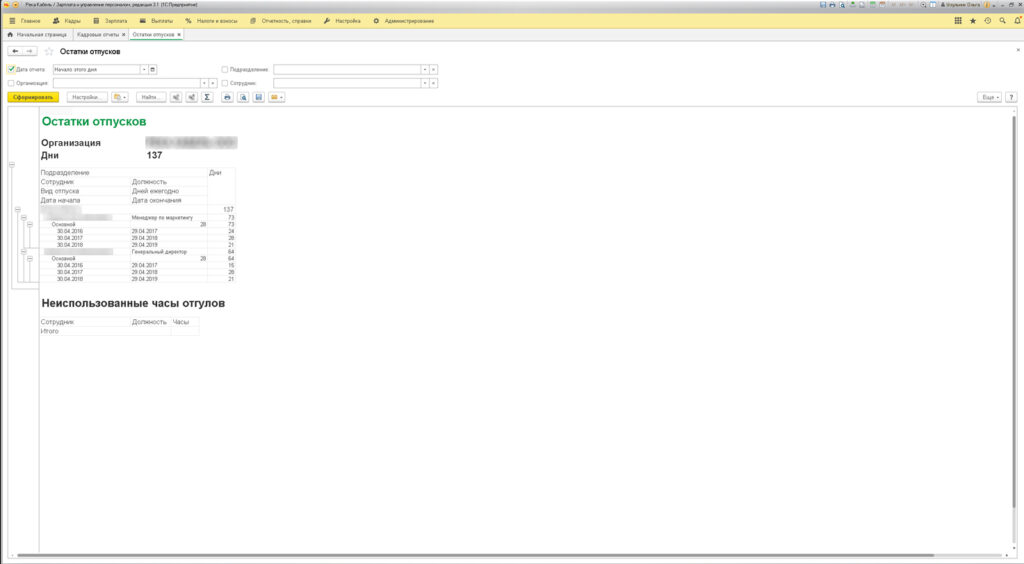
This report provides the number of vacation days accrued for each employee from their hire date, when and how many vacation days have been taken and how many vacation days are left to be taken by employees.
For a more convenient viewing of general data, it is possible to hide detailed information about used vacation days and see only vacation balances for each employee.
This may be customized by department and by employee.
How does this help managers?
Information about vacation may be useful for managers to understand:
- how many days an employee can go on vacation;
- how much should be paid to as compensation for unused vacation days in case of employee dismissal.
Staff absence
Where?
HR → HR reports → Staff absence
What for?
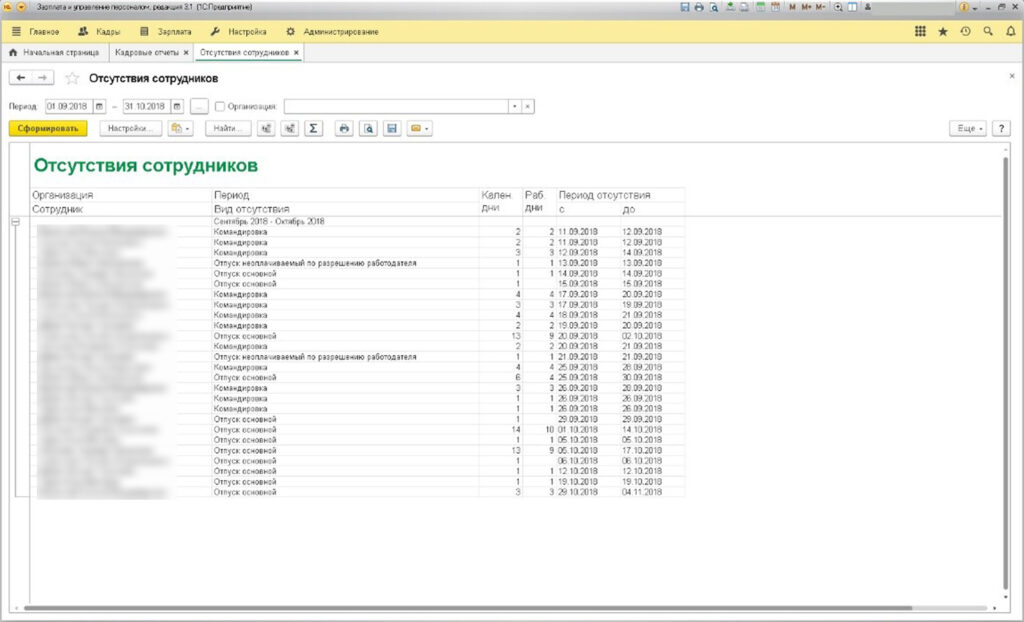
- This reports indicates when, how many days and why employees were absent.
- It allows finding out how many days employees spent on business trips and evenly distributing workload, if necessary.
- It allows understanding how often employees are on sick leave and whether this affects the quality of work.
For example, if an employee takes leave to care for his/her child, then the period for which leave days are paid will be limited. Once the number of days set by law is exceeded, another payment procedure will apply. The number of days of paid sick leave depends on the age of the child.
If a child under the age of 7 is sick, then sick leave benefit will be paid for a maximum of 60 days per year. Exceptions are made for diseases from List No. 84n, in such case, a maximum of 90 days of sick leave benefit is granted per year.
In case of children over the age of 7, benefit is received only for 15 days per sickness and cannot be received for more than 45 days per year.
No benefit is paid for any days beyond this annual threshold, but such sick leave days are recognized as a valid reason for absence from work.
The data in this report may be generated for a department, employee or several employees as selected.
Our services
Send message
Please describe your situation and we will find an optimal solution for your business.
info@konsugroup.com